

MPS Monitor
Global leader is Saas for managed print services delivery rich analytics to customers with Power B Embedded.

Founded in Italy in 2010, MPS Monitor is now a globally recognized leader in SaaS for the Managed Print Services (MPS) industry.
MPS Monitor is a worldwide leader in the development of software for Managed Print Services and it provides complete SaaS cloud platform for remotely monitoring and managing printers. Thousands of dealers in more than 60 countries use MPS Monitor to manage a fleet of more than 1,000,000 printing devices. MPS Monitor leveraged Microsoft Power BI and Azure to deliver a comprehensive and easy-to-use data analytics environment and provide visual and interactive access to data for customers. This enabled users to get control and have clarity on critical business factors and metrics that affect costs, operational efficiency, and service performances.
- GDPR compliant, ISO/IEC 27001, SOC 2 Type 2 and CSA Star Level 2 certified.
- Close collaboration with office equipment dealers, MPS providers, distributors and vendors.
- Global presence, with offices in Europe, USA, and Korea, and customers in 75+ countries.
”The use of Microsoft Power BI Embedded technology provides extremely sophisticated analysis even for users without previous BI experience, thanks to its extreme user friendliness."
Nicola De BlasiCEO for MPS Monitor
Key Features
- Device Web Access
- Label printer support
- Invoicing / contract management
- Uploading of data (customers, devices, locations etc.)
- Granular User roles / SSO integration
- Scheduled email reports
- DCA clustering / redundancy
- Security certifications
Key Facts
- Over 2 Million printing devices connected, located in more than 75 countries
- 50,000 registered user accounts
- 3,500 active Dealers
- 50 Billion pages tracked in the last year
- 320,000 customers monitored
- 410,000 Data Collection Agents running into customers’ networks, on 15 different Operating Systems
Awards & Market Recognitions

Before the adoption of Power BI, the company relied on multidimensional OLAP CUBEs to provide basic BI functionalities. Data were processed every night in the cloud system and updated daily—not in real time. This required a massive amount of data to be sent to customers every day via file-sharing services as CUBE files.
Customers would then connect to those files and interact with data using Excel pivot tables, but out of the 40,000 users of MPS Monitor’s web portal less than 5 percent have the advanced knowledge needed to gain insights from data in this format. This data environment made it increasingly difficult and time-consuming to create useful and compelling reports and graphics, as well as sharing those visualizations.
The fact that its BI capabilities were not integrated with MPS Monitor’s existing web portal meant it was not scalable. As its number of users began to grow, it became increasingly difficult to produce and distribute hundreds of CUBEs every day and the OLAP environment become more challenging to maintain.
In response to this challenge, Nicola De Blasi, CEO, and Alberto Gastaldo, Chief Data Officer, at MPS Monitor made plans to implement a more advanced BI environment that could better meet their needs. The data analytics solution needed to fulfill some fundamental requirements such as full self-service capabilities and ease-of-use— even for non-technical users—to allow users to create and customize their own analysis and reports, without any involvement of software developers or BI experts.
De Blasi and Gastaldo were also keen for their solution to have real-time data sync with the operational database, high-performance processing of large amounts of data, and full integration in the platform with transparent access inside the web application portal—no external services or additional accounts needed.
Data and Business Expertise Fusion Delivers Strategic BI Solution
Leadership at MPS Monitor knew they wanted to take advantage of integrating with their existing Microsoft platforms, so Power BI was a natural fit. They could also leverage the existing internal knowledge of certified trainers (MCTs) who deliver training courses on Power BI. To achieve their goals, they needed a fully integrated BI experience within the MPS Monitor web portal to prevent the need for users to access data in multiple places, manage additional accounts, or be trained on an external application.
De Blasi and Gastaldo envisioned BI as an integral part of their web application, fully transparent and deeply integrated. Also, because it was not possible for the company to manage thousands of requests coming from customers for specialized reports and dashboards, their solution needed options for self-service to allow users to create reports independently.
Power BI Embedded platform satisfies all of these business and technical requirements as well as being powerful, expandable, and a market leader. De Blasi says, “We were looking for a market-leader tool such as Power BI Embedded that guarantees investment over time. Also, the presence of video tutorials, communities, blogs, courses, etc. was another key factor in the software selection—especially for more advanced users who may want to do self-training or search for help while authoring reports.”
Their BI solution, called MPS Monitor Analytics, was designed and implemented entirely by the MPS Monitor core team without any external resource. Their team took a fusion approach to solving their business challenges— including data experts, front-end developers, and businesspeople—to ensure that both data model and user experience were adequate to the project’s expectation. Their philosophy of continuous improvement in BI and every aspect of how they do business drove focus on delivering a quality solution for their customers rather than completing it in a specific timeframe.
The initial project launch was led by Gastaldo, an MCT-certified data expert with deep skills on Microsoft BI technologies who has been working several years as a Power BI trainer for official Microsoft Official Courses (MOCs) and custom BI courses. He currently leads a team of four senior data experts with deep expertise in data platform, DB management and development, and all of whom contribute significantly to the success of the solution.
Stunning Visuals Display Critical BI with Little Time Investment
Ultimately, the team decided to transform the existing OLAP environment in a newly designed SQL Server Analysis Services Tabular Data Model. Most of the effort was dedicated to the Data Model design to ensure optimal performance—even in a fully online environment with a very large database and thousands of concurrent users accessing the platform.
Next, they incorporated Power BI Embedded technology, which enables access of the new analytics functionality within the existing web portal and security model. Lastly, the developers created a library of default reports to provide users the main and basic information and to show the potential of the tool.

1 Users input existing username and password into MPS Monitor Web Portal
2 User verified through app to access web portal
3 Service principal authentication acquires app token when user accesses reports
4 User gains access to:
- User workspaces with personal reports
- System workspaces with system reports
- Widget reports
Data flow visualization shows how user engagement triggers Power BI Embedded capabilities within the existing data sources.
MPS Monitor’s ETL process uses SSIS packages to extract data from OLTP into staging tables inside the data warehouse. Then, using stored procedures and mainly merge statements, data is pushed into fact and dimension tables, which are then loaded into the SSAS tabular model. Data are stored in a single, multi-tenant Tabular Data Model, where all customer data are present. MPS Monitor Analytics uses row level security to ensure that each of the users has access only to the data allowed for its account.
Typical users of the MPS Monitor portal are operational professionals who manage consumables, logistics, invoicing, and maintenance within Managed Print Services engagements, such as finance managers and service managers. Users access MPS Monitor Analytics from within the MPS Monitor portal via a tab on the left-hand side of the web app, which means no additional authentication is required.
Once inside the portal, customers can access default system reports—created by the internal MPS Monitor team —in read-only mode, or “clone” a system report in the personal area, allowing them to create, edit, and delete personal reports. MPS Monitor also provides customers with access to Power BI training resources within a web portal catered to all skill levels.

A list of system (default) reports available on the left column and personal reports on the right column.
Within individual reports, whether default or custom, users can simply right-click on an available link to perform drill-down functions in order to gain targeted, specific data analytics without needing to complete complex data queries.
Users are also able to customize which reports show up on their home screen dashboard by default without having to navigate to the Analytics tab. This gives customers instant access to reports that display the most relevant data such as fleet performance by geographic location, which printer platforms are being used most/least, print volumes, and more.


A preconfigured drill down on print volumes by dealer which users only need to click on to access data insights.
In the spirit of perpetual innovation, Gastaldo and De Blasi realized they could make it even easier for their customers to gain quick access to BI without the need to navigate to the Analytics tab. The internal development team accomplished this through the extensibility to embed Power BI capabilities anywhere within the MPS Monitor web portal by creating single-page, drill-down reports called widgets that can exist outside of the larger system reports.
BI widgets are simple, one-page Power BI reports linked to buttons disseminated in the various functions and pages in the application. Essentially, the user finds a button in a page which opens a pop-up window with a very simple yet effective data drill down on the information present in that page. For example, from the customer’s page, users can open a widget to see how their fleet is composed in terms of brands, models, and types of devices—all with the click of a button and without any complex search or extraction.
“The addition of the widgets function was unexpected, because we initially planned to keep our BI user experience consolidated in a single and separate application; a sort of portal subsection dedicated to Power BI,” explains De Blasi. “Having learned how easy and effective it is to create embedded reports, we have started to create and position the widgets—almost for fun—in many areas within our entire web portal. Now, the customers have beautiful, detailed BI reports that offers insights at a glance.”


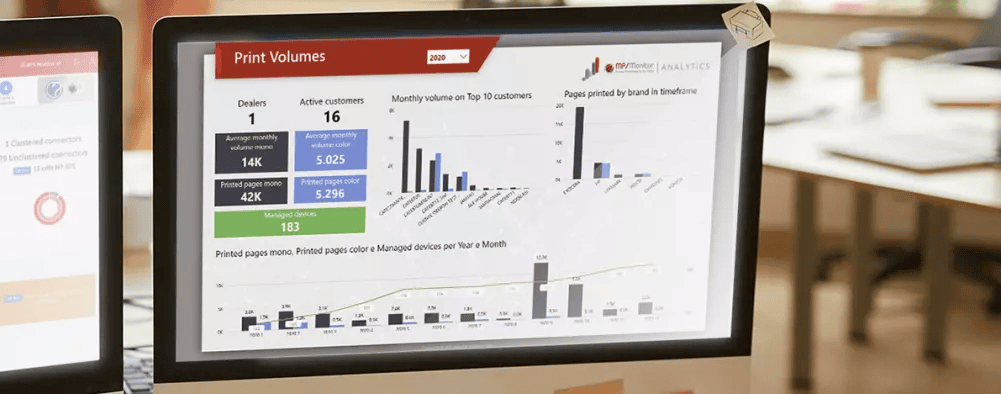
One-page widget reports display information such as number of pages printed, supplies intelligence, and information about managed devices.
This robust, but simply added feature to MPS Monitor’s solution makes critical data such as profitability by customer and predictive demand of consumables instantly accessible to customers. The widget reports are created internally by the development team and are intentionally not editable. This way, it caters to the user that wants instant BI without having to navigate to reports or needing to perform their own customization.
“It took us less than a day to create an individual widget report with Power BI Embedded,” says Gastaldo. “If we had needed to engage a developer to create something like this on the frontend framework, it would have taken two weeks. And the analytics wouldn’t be nearly as beautiful of a visualization.”
Full Self-Service BI Experience Attracts New Customers
The MPS Monitor Analytics solution enables users to access a full BI environment from within their previously existing web application—all without the need for separate accounts, different portals, or additional licensing. They now offer a full self-service BI experience with the ability to modify existing reports or to create new ones form a blank canvas, and no need to pay (or wait) for developers to create new BI reports.
Additionally, customers can learn how to use BI by accessing the huge knowledge base available on Power BI on the Web, which eliminates the need to provide complex and expensive customized training. All the while, MPS Monitor has experienced excellent performance using an online Tabular data model with direct access to the data source, removing the need for any on-premises server or local component.
The commercial value that this platform brings to MPS Monitor and to its customers is significant. About 40 percent of new subscribers say that the presence of BI features has influenced greatly their decision to use MPS Monitor’s services. Ninety percent commented that having migrated from a previous monitoring system to MPS Monitor, the former system did not have anything comparable to their BI features.
As De Blasi states, “For over a decade, MPS Monitor has been the ideal solution for dealers in the Print industry. The powerful features of our analytics solution allow the user to understand all the operational and economic trends and indicators related to a fleet of printing devices. The use of Microsoft Power BI Embedded technology provides extremely sophisticated analysis even for users without previous BI experience, thanks to its extreme user friendliness.”
Lifelong Innovation
MPS Monitor is also a Universal Print Partner and has built a deep integration between their platform and Universal Print, to enable users to have a single SaaS platform where they can manage most of their needs and activities related to their printer fleet. Their goal is to help dealers and customers to move their print server to Azure cloud services using MPS Monitor.
They plan to add data coming from Universal Print—like Print Jobs and usage of printers by each user—into the same data model. Ultimately, this will significantly enrich the existing data visualizations and analytics provided using Power BI Embedded, thus providing a complete BI platform for everything related to printing activities, processes, and costs.
”It took us less than a day to create an individual widget report with Power BI Embedded. If we had needed to engage a developer, it would have taken two weeks. And the analytics visuals wouldn't be nearly as beautiful.”
Alberto GastaldoChief Data Officer for MPS Monitor